
The Total Cost of Ownership Gap: What Most Manufacturers Are Leaving in Their Supply Base
Insights Article
Per-unit price negotiations capture only part of the available savings. A look at how TCO analysis surfaces the quality, logistics, and lead time costs that incumbents have quietly shifted onto your P&L

Dan Bleicher, Partner, Inside Consulting
Published May 29, 2026
The limits of price-based negotiation
Most procurement teams at mid-market manufacturers evaluate suppliers on unit price. The sourcing process involves sending an RFQ, receiving bids, selecting the lowest compliant price, and declaring the exercise complete. This approach produces savings that are real but incomplete. It misses the costs that do not appear on the vendor invoice.
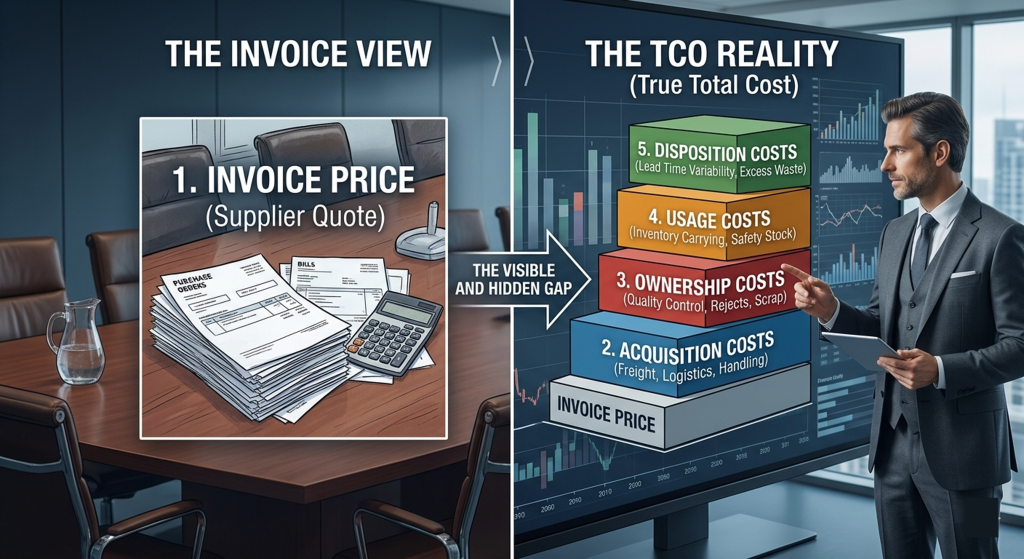
Total cost of ownership analysis starts from a different premise: that the true cost of a purchased component or material is the unit price plus every other cost the supplier relationship generates for your organization. Quality failures, logistics inefficiencies, premium freight charges, inspection overhead, expediting costs, and inventory buffer requirements all have dollar values that belong in a complete supplier cost picture.
For manufacturers who have never applied a TCO framework to their supply base, the gap between invoice cost and total cost is frequently significant. The exact magnitude depends on the supplier’s quality performance, geographic location, lead time reliability, and packaging practices, but organizations running TCO analyses for the first time routinely find that their lowest-price supplier is not their lowest-cost supplier once all variables are quantified.
The four TCO cost categories most manufacturers undercount
1. Quality failure costs
When a purchased component arrives out of specification or fails in production, the visible cost is the replacement part. The full cost includes incoming inspection labor, rework time, line disruption, scrap, warranty exposure on finished goods, and the administrative cost of supplier corrective action processes. These costs accumulate transaction by transaction and are typically buried across multiple cost centers rather than tracked against the responsible supplier.
Quality cost allocation is the analytical step that most price-focused procurement processes skip. When a supplier with a 2 percent defect rate quotes 5 percent below an alternative with a 0.3 percent defect rate, the arithmetic on total cost frequently favors the alternative once quality-related costs are fully attributed.
2. Logistics and freight costs
Freight terms and shipping costs are negotiated separately from unit pricing in most sourcing events, which means they are frequently left out of the comparison entirely. A supplier quoting FOB origin with expensive freight adds landed cost to every purchase that may eliminate the apparent price advantage. Expedited freight charges driven by supplier lead time failures are a related and often larger cost that does not appear in any unit price comparison.
For manufacturers sourcing globally, logistics costs are a larger share of total cost and involve more complexity. Transit time, customs clearance costs, port delays, and currency exposure all affect the landed cost of an imported component in ways that a domestic unit price comparison will not capture.
3. Inventory carrying costs driven by lead time
A supplier with 16-week lead times requires a fundamentally different inventory strategy than a supplier with 4-week lead times. The additional safety stock required to buffer against a long-lead supplier’s variability has a real cost: the carrying cost of the inventory, the working capital tied up, and the warehouse space consumed. These costs scale with lead time length and with lead time variability. A supplier who quotes 8 weeks and regularly ships at 10 or 12 weeks is more expensive to buffer than a supplier who quotes 6 weeks and consistently hits that target.
Inventory carrying cost is commonly estimated at 20 to 30 percent of inventory value annually, a figure cited in operations management literature and used widely in supply chain financial modeling. Applying even a conservative carrying cost rate to the incremental inventory required by a long-lead supplier can shift the total cost comparison meaningfully.
4. Administrative and transaction costs
Supplier relationships that require frequent expediting, ongoing corrective action management, complex invoicing reconciliation, or dedicated supplier development resources impose administrative costs that belong in the TCO calculation. A supplier who requires 10 hours per month of procurement staff time to manage is more expensive than one who requires one hour, even if their unit prices are identical. These costs are real even when they do not appear on any invoice.
Building a practical TCO model
A workable TCO model does not need to be complex. It needs to be consistent across suppliers and grounded in data your organization already has or can collect. The goal is a side-by-side comparison that converts each cost category to a dollar-per-unit or dollar-per-year figure so that the total cost of each supplier option can be compared on a common basis.
A practical TCO model for direct materials sourcing includes:
- Unit price at quoted volume
- Landed freight cost per unit based on freight terms and estimated shipping costs from supplier location
- Quality cost allocation based on the supplier’s historical or quoted defect rate multiplied by your internal cost-per-defect estimate
- Inventory carrying cost increment based on the additional safety stock required to buffer against the supplier’s lead time and variability, multiplied by your carrying cost rate
- Estimated administrative cost based on expected management intensity for the supplier relationship
The inputs do not need to be precise to be useful. An estimate of quality cost that is directionally correct is more informative than no quality cost at all. The model’s value is in making hidden costs visible and comparable, not in producing a precise accounting of every dollar.
Where organizations have supplier performance history, use it. Where they do not, build the model around supplier-quoted commitments and revisit the analysis after 12 months of performance data has accumulated.
How incumbents shift costs onto your P&L
Long-tenured incumbent suppliers benefit from relationships that have made their cost footprint invisible. When a supplier has been on your approved vendor list for five years, the operational adaptations your organization has made to work around their performance limitations have become routine. Nobody notices the safety stock buffer that exists because this supplier’s lead times are unreliable. Nobody tracks the inspection resource dedicated to incoming parts from this vendor. These adaptations are just how things work.
TCO analysis makes these adaptations visible by asking a different question: not “what does this supplier charge us?” but “what does this supplier cost us?” The answer reframes the incumbent relationship and, frequently, changes the calculus on whether switching suppliers is worth the transition cost.
The most common cost-shifting patterns to look for in incumbent supplier relationships are extended payment terms being quietly shortened on renewals, freight term shifts from delivered to FOB origin that transfer shipping cost to the buyer, quality performance that has degraded gradually without triggering a formal corrective action, and lead time extensions that have been absorbed through safety stock increases rather than addressed as a supplier performance issue.
Applying TCO in a sourcing event
TCO analysis is most powerful when it is built into the sourcing event design rather than applied after the fact. When suppliers understand that they are being evaluated on total cost rather than unit price, it changes what they compete on. Suppliers with stronger quality performance and more reliable delivery can price to reflect that advantage. Suppliers who have historically won on low unit price while delivering inferior quality and unreliable service face a more honest competitive comparison.
In practice, this means including quality performance commitments, lead time guarantees, and freight terms in the RFQ requirements rather than treating them as secondary considerations. Suppliers who cannot meet minimum quality or lead time thresholds should be scored accordingly, even if their unit price is the lowest in the field.
For CFOs evaluating sourcing results, a TCO-based comparison is also more defensible than a unit price comparison when presenting procurement savings to a board or PE sponsor. It demonstrates that the analysis accounted for the full cost of ownership and that the selected supplier represents genuine value rather than a price that looks good on paper but generates hidden downstream costs.
Work with Inside Consulting
Inside Consulting works with mid-market manufacturers and PE-backed industrial platforms to build TCO frameworks, run competitive sourcing events, and identify the supply base costs that price-based negotiations consistently miss.
Engagements are structured on at-risk and hybrid fee models with measurable savings delivered within the first 60 to 90 days.
Learn more about our approach to industrials procurement optimization at: Industrials Procurement Optimization
We run a no-cost spend assessment and give you a category-level view of where procurement savings are most likely before any engagement begins.
Schedule a No Cost Spend Assessment
Related Resources
References
- Inventory carrying cost rate of 20 to 30 percent of inventory value annually is a widely used estimate in operations management and supply chain literature. See: Chopra, S. & Meindl, P. Supply Chain Management: Strategy, Planning, and Operation, 7th ed. Pearson, 2019. Also referenced in: APICS (now ASCM) Supply Chain Dictionary.