The Consumption Blind Spot: Sourcing and Managing Variable-Cost Technology Spend

White Paper
A procurement roadmap for CFOs, PE operating partners, and technology sourcing leaders at mid-market companies navigating the shift to usage-based software, cloud, and telecom spend

Mac Hodell — Partner, Inside Consulting
Published June 7, 2026
For decades, enterprise software pricing followed a logic that CFOs and procurement leaders understood intuitively: negotiate a per-seat license, lock in a term, and budget accordingly. That model is disappearing. In its place is a consumption-based paradigm where costs scale with usage, overages arrive as invoice surprises, and the variance between what was budgeted and what was billed can be severe. This paper explains why the shift is structural, what failure looks like operationally, and how procurement leaders can build the monitoring infrastructure and governance discipline to convert unpredictable variable-cost technology spend into a manageable lever.
The structural shift in enterprise software pricing
The migration from seat-based to consumption-based pricing is not a vendor experiment. It is a durable structural shift with momentum across every major enterprise software category. McKinsey research documented that the number of software companies using consumption-based pricing models more than doubled between 2015 and 2024, driven initially by cloud infrastructure vendors and now accelerating as AI-powered software tools monetize at the unit-of-work level rather than the user level.
The economics driving this from the vendor side are straightforward: consumption models align revenue to customer value delivered, create natural expansion as usage scales, and shift financial volatility from the vendor’s income statement directly onto the customer’s operating budget. That last point is the one CFOs and procurement leaders are underequipped to manage.
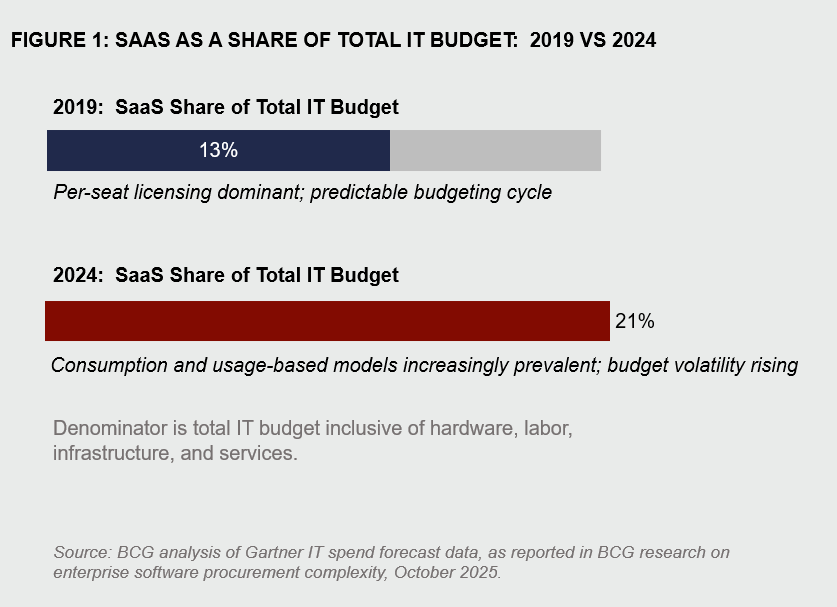
The scale of the budget exposure is significant. BCG’s analysis of Gartner IT spend data found that SaaS grew from 13 percent to 21 percent of total technology budgets between 2019 and 2024, nearly doubling the software share of IT expenditure in five years. That denominator is broad: the total IT budget includes hardware, IT labor, professional services, on-premises infrastructure maintenance, network, and telecom. SaaS at 21 percent of that full base is a material and fast-growing exposure. BCG noted directly that as vendors move away from predictable licensing, procurement has become harder to track, resulting in redundancies and a proliferation of underutilized or over-provisioned software that organizations pay for but do not fully use.
The vendor categories leading this shift span the full technology stack. Cloud infrastructure providers have operated on consumption models for years. The newer wave is enterprise SaaS: AI coding assistants, data analytics platforms, marketing automation tools, and workflow automation products that are priced by API call, by task completed, or by data record processed. Telecom remains its own category of complexity, with usage pools, roaming exposure, and line-level billing that most mid-market procurement teams have never audited with genuine rigor.
Mid-market companies face disproportionate exposure relative to large enterprises for a structural reason: enterprise buyers typically operate dedicated vendor management offices, technology business management functions, and FinOps teams whose sole job is monitoring consumption against contract. Mid-market operators rarely have that infrastructure. Consumption variance, the gap between what was budgeted and what was billed, tends to be identified after the fact, as an invoice problem rather than a spend management problem.
The anatomy of the consumption blind spot
Consumption costs compound silently in ways that per-seat licensing costs do not. With seat-based pricing, the monthly charge is deterministic: you know what you owe the moment the contract is signed. With consumption-based pricing, the monthly charge is a function of actual usage, influenced by every employee, every workflow, and every automated process that touches the platform. Finance learns the true cost when the invoice arrives.
The gap between provisioned, actual, and billed usage is where organizations lose money without realizing it. Provisioned usage is what was budgeted or committed at contract. Actual usage is what the organization consumed. Billed usage is what the vendor invoiced, which may include overages, minimum commit true-ups, and usage-tier step-ups embedded in contract language that were never flagged during negotiation. In many cases, all three numbers are different, and the organization has no systematic way to reconcile them.
Four failure modes create this condition. They are not independent; they typically operate in combination, which is why the problem compounds.
Figure 2: The four failure modes of consumption spend management
These four failure modes operate in combination. An organization with decentralized purchasing and no real-time visibility cannot act on contract clause exposure even when someone flags it, because there is no system of record to consult and no ownership structure to escalate through.
The cost categories where these failure modes manifest most visibly include cloud infrastructure egress and compute overages, AI API usage (which can escalate from negligible to material in weeks as adoption scales), telecom usage pools that spill into per-unit overage rates, and SaaS platforms where the organization is paying for seat tiers or feature bundles well above actual use. Gartner data indicates that organizations are typically aware of only approximately 40 percent of the SaaS applications actually in use, meaning the majority of the portfolio operates outside procurement’s line of sight entirely.
— CIO.com, January 2026
The FinOps Foundation’s 2025 State of FinOps survey found that 65 percent of organizations now include SaaS spend in their FinOps practice, a recognition that the cloud cost management discipline developed for infrastructure spend must now extend to the full consumption technology portfolio. That figure also implies that 35 percent of organizations have not made that extension and are still managing SaaS through periodic invoice review processes built for predictable licensing.
Building the foundation: governance before technology
The most common procurement response to a consumption spend problem is to procure a tool: a SaaS management platform, a FinOps dashboard, or a spend analytics solution. This is understandable and, in isolation, insufficient. Technology surfaces data. It does not create accountability, resolve organizational silos, or compel business units to change purchasing behavior. Those outcomes require governance, and governance must be designed before technology is layered on top of it.
McKinsey’s research on procurement’s expanded strategic role found that the vast majority of CPOs surveyed lacked technology platforms capable of thorough, integrated, real-time data processing, and that less than 20 percent of their organizations’ available procurement data was currently being used. The constraint is not data availability. It is the organizational infrastructure to act on data once it exists.
Establishing a consumption spend taxonomy
Cloud, SaaS, and telecom are not a single category. They have fundamentally different cost drivers, billing mechanics, contract structures, and optimization levers. Treating them as a single technology spend line item is the first governance error. A consumption spend taxonomy assigns each category its own tracking logic, its own owner, and its own performance metrics.
Cloud infrastructure spend tracks against provisioned versus actual compute, storage, and egress. SaaS spend tracks against licensed capacity versus active utilization, and against contract tier versus actual feature usage. Telecom tracks against pooled minutes, data, and line allowances versus actual usage, with specific attention to roaming exposure and orphaned lines. These are different measurement problems requiring different data sources and different review cadences.
Vendor master data hygiene
Before any monitoring infrastructure can function, the organization needs a single source of truth for what it has contracted. This means every active consumption-based vendor agreement captured in a master record that includes: pricing tier and unit rate, overage threshold and overage rate, minimum commit obligation, auto-renewal date and notice window, and the internal owner accountable for that relationship. In most mid-market organizations, this data lives in inboxes, shared drives, and the memories of employees who may no longer be in the role. Establishing vendor master data hygiene is not a technology project; it is a process discipline that typically takes 30 to 45 days of focused effort to complete for the first time.
Defining ownership
Every consumption spend line item needs a named owner who is accountable when that line item spikes. Without defined ownership, budget alerts become organizational hot potatoes: finance flags the issue, IT says it is a business decision, the business unit says it did not know the cost structure. Ownership assignment is not complex, but it must be explicit and enforced by the CFO or CPO as a condition of decentralized purchasing authority.
Real-time monitoring: from reactive invoicing to proactive spend intelligence
Once the governance structure is in place, the monitoring infrastructure can be built to actually deliver value. Real-time consumption monitoring means the organization knows where it stands against budget before the invoice arrives. This requires three components operating in parallel: data ingestion, baseline establishment, and alert protocols.
Data ingestion
Most enterprise vendors expose consumption data through APIs, vendor portals, or downloadable usage reports. The monitoring infrastructure must connect to these sources on a cadence that matches the cost volatility of each vendor. Cloud infrastructure spend may require daily or hourly monitoring. SaaS utilization may require a weekly review. Telecom may require monthly line-level auditing with roaming-specific alerts triggered in real time during travel periods.
Establishing consumption baselines
Anomaly detection requires a baseline. For each vendor, the organization should establish a normal consumption range by department, by use case, and by time period. A usage spike that represents a legitimate business activity looks identical to an erroneous runaway process at the invoice level. Baselines allow the organization to distinguish between them and respond appropriately.
Budget alert triggers and escalation protocols
Alert protocols must be calibrated to allow time to act. A vendor notification that you have crossed 90 percent of committed spend with three days left in the billing period is operationally useless. Effective alert design triggers at 60 percent and 80 percent of commit, with escalation to the named owner at 60 percent and to finance leadership at 80 percent. The escalation protocol defines what the owner is expected to do when the alert fires, not simply acknowledge it.
Telecom-specific considerations
Telecom deserves separate treatment because its audit requirements differ materially from those of SaaS and cloud. Line-level auditing, which means verifying that every active telecom line corresponds to an active employee or device with a legitimate business need, is the foundational discipline, and it is consistently under-executed. Mid-market companies routinely carry orphaned lines from employee departures, unused mobile data allocations, and legacy voice lines that predate remote work transitions. A systematic telecom audit conducted against the current employee roster and device inventory will surface immediate savings in virtually every engagement. Roaming exposure requires a separate protocol: usage-based roaming charges can accumulate materially during international travel periods before any alert is triggered under standard billing review.
Procurement strategy for variable-cost vendors
Monitoring tells you what is happening. Procurement strategy determines what your exposure is and how much flexibility you have when consumption deviates from plan. Consumption-based contracts require a fundamentally different negotiation approach than fixed-fee agreements, and most procurement teams are not yet proficient in this discipline.
Negotiating consumption-based contracts
The key variables in a consumption contract are: the committed spend or usage floor, the unit rate at each tier, the overage rate above the commit, the true-up mechanics at period end, and the notice period and conditions for adjusting commitments mid-term. Each of these is negotiable, and most buyers focus only on the initial unit rate, treating everything else as standard terms. The overage rate is often the most consequential variable; a vendor charging 1.5x the standard rate on consumption above commit can turn a modest usage overage into a material budget event.
McKinsey’s research on consumption model mechanics highlights that enterprise vendors are increasingly offering “true forward” mechanisms, where excess consumption in a prior period adjusts the commit for the next period rather than triggering an immediate overage charge. This is a meaningful term improvement for the buyer, and one worth pushing for explicitly in negotiations.
Building optionality into contracts
Consumption volatility is, in part, a contract design problem. Agreements that lock the buyer into rigid annual commits without downward flexibility transfer all demand risk to the buyer. Procurement leaders should negotiate explicit flexibility provisions: the ability to reduce committed tiers at each annual renewal, volume flexibility clauses that allow commit adjustment if the organization undergoes a material change, and clear exit provisions if the vendor discontinues features material to the use case.
Vendor segmentation for active management
Not every consumption vendor warrants the same procurement attention. The segmentation logic that drives management intensity should rest on two variables: consumption volatility and spend magnitude. High-spend vendors with volatile consumption require active, ongoing management: dedicated monitoring, frequent business reviews, and renegotiation cycles that precede auto-renewal by at least 90 days. Low-spend vendors with stable consumption can be monitored with quarterly reviews and standard alert thresholds. The vendors in between require a clear segmentation decision: managed actively or monitored passively.
Figure 3: Consumption vendor segmentation matrix
Management intensity mapped to spend magnitude and consumption volatility
Inside Consulting vendor segmentation framework for consumption-based technology spend. Segmentation should be reviewed semi-annually as vendor relationships and usage patterns evolve.
Vendor consolidation as a consumption management lever
Decentralized purchasing of consumption-based tools creates not just visibility problems but negotiating leverage problems. An organization with four overlapping AI writing tools, each purchased independently by different business units, has neither consolidated spend power with any single vendor nor a clear view of aggregate capability utilization. Consolidation serves two purposes simultaneously: it simplifies the consumption tracking surface and creates the volume concentration that improves negotiating position. The analysis that precedes consolidation, mapping overlapping capabilities against actual utilization, typically surfaces both redundant spend and underutilized capacity that can be eliminated without any capability loss.
For further analysis of vendor consolidation strategy, see our guide to SaaS vendor consolidation for mid-market operators.
The CFO’s playbook: converting consumption spend into a managed lever
The operational work of consumption spend governance, including taxonomy, monitoring, and vendor segmentation, must translate into financial reporting and planning frameworks the CFO can use to manage the business. Without that translation, procurement has better data and the budget is still unpredictable.
Integrating consumption data into FP&A
Consumption spend should feed a rolling 13-week forecast integrated into the FP&A cycle. This forecast takes current-period consumption run rates by vendor, projects forward against committed spend floors and known usage drivers, and flags variance risk in advance of the billing period close. The 13-week horizon matches the notice periods in most consumption contracts, giving finance and procurement enough lead time to adjust commits, reduce utilization, or initiate a vendor conversation before a material overage becomes an invoice.
Variance analysis and the EBITDA connection
For PE-backed and growth-stage mid-market operators, consumption spend variance is an EBITDA story, not just a budget management story. A material annual overage on cloud and SaaS contracts is a direct EBITDA drag at a company where that spend category was budgeted and signed off by the board. Framing procurement performance in those terms, with consumption efficiency as an EBITDA lever, elevates the function from operational housekeeping to value creation. It also creates the stakeholder alignment that effective consumption governance requires: when the CFO reports technology spend variance to the board as an EBITDA line item, the business units that control consumption behavior face accountability they would not otherwise have.
— McKinsey & Company, A New Era for Procurement Value Creation (2023)
KPIs to track and report
Consumption spend management requires forward-looking metrics, not traditional backward-looking procurement KPIs:
- Consumption efficiency ratio: actual spend as a percentage of provisioned capacity, by vendor. A ratio significantly below 100 percent signals over-provisioning. A ratio approaching or exceeding 100 percent signals overage risk.
- Overage frequency: number of vendors triggering overages per billing period, tracked as a trend. Rising overage frequency is an early warning signal of governance breakdown.
- Forecasted run rate vs. budget: current-period consumption trajectory projected to period end, compared against approved budget. This is the number that enables proactive intervention.
- Vendor concentration risk: percentage of total consumption spend concentrated in vendors with high volatility profiles.
- Auto-renewal exposure: aggregate spend on contracts renewing automatically within the next 90 days without active renegotiation underway.
For a broader view of how AI-era procurement strategy is reshaping the SG&A cost structure, see our analysis of SG&A procurement in the AI era. For growth-stage operators specifically, the dynamics of technology spend accumulation are detailed in our piece on the growth tax and how CFOs can close the gap.
Implementation roadmap: 90-day activation plan
The governance infrastructure described in this paper is achievable within a 90-day activation window for most mid-market organizations. The sequencing matters: data before tools, governance before monitoring, monitoring before renegotiation.
Figure 4: 90-day consumption spend activation roadmap
- Inventory all active consumption-based vendor agreements
- Extract contract terms: commit levels, overage rates, auto-renewal dates
- Pull 12 months of actual consumption data by vendor
- Map provisioned vs. actual vs. billed usage gaps
- Identify orphaned telecom lines and unused SaaS capacity
- Establish a vendor master data record
- Assign named owners to each consumption spend category
- Segment vendor portfolio using the 2×2 framework
- Stand up API or portal-based consumption data feeds
- Set consumption baselines and anomaly thresholds
- Configure budget alert triggers and escalation protocols
- Launch rolling 13-week consumption forecast in FP&A
- Prioritize vendors for renegotiation based on segment and renewal proximity
- Initiate contract amendment discussions on overage rate and flexibility terms
- Execute demand management on over-provisioned capacity
- Consolidate overlapping vendor capabilities where appropriate
- Establish a recurring reporting cadence for CFO and the board
- Document lessons learned and refine the ongoing governance model
Inside Consulting 90-day activation framework for consumption-based technology spend management. Specific timelines will vary by organization size and complexity of the existing vendor portfolio.
Conclusion: from cost volatility to competitive advantage
The consumption-based pricing model is not going to reverse. The vendor economics are compelling, the AI-driven acceleration of usage-variable products is structural, and the CFO who waits for predictable licensing to return is making a budget management decision that will cost real money in the interim.
Organizations that treat consumption spend governance as a priority — building the data infrastructure, assigning ownership, establishing real-time monitoring, and applying disciplined contract strategy — convert what is currently an unpredictable liability into a managed, optimizable cost line. The compounding benefit over time is meaningful: each renewal cycle approached with a current baseline, an active monitoring history, and a segmented vendor portfolio is a negotiation conducted from a position of information advantage rather than reactive catch-up.
For PE-backed operators, the framing is direct. Consumption spend governance is an EBITDA lever that does not require headcount reduction, revenue growth, or pricing action. It requires organizational discipline, procurement rigor, and the decision to treat variable-cost technology spend as a category that warrants active management rather than periodic invoice review.
The tools, the frameworks, and the playbook exist. The gap is almost always execution. Organizations that close that gap consistently outperform those that do not.
For related analysis on how vendor relationships are exploited through reseller markups and hidden margin, see our piece on the reseller margin trap.
Inside Consulting works with mid-market CFOs, PE operating partners, and technology sourcing leaders to identify and recover overspend across SaaS, cloud, and telecom. Our no-cost spend assessment gives you a category-level view of where consumption exposure is highest and which vendors warrant immediate attention, before any engagement begins, and with no obligation to proceed.
We map your current SaaS, cloud, and telecom spend against contract terms to identify overage exposure, shelfware, and consolidation opportunities.
You receive a prioritized view of which vendor categories carry the highest savings potential and which contract renewals warrant immediate action.
The assessment findings are yours regardless of next steps. Most clients see enough to act immediately; all of them leave with a clearer picture of their exposure.
Glossary of consumption pricing terms
The terminology used in consumption-based contracts is not standardized across vendors. Understanding these terms precisely is a prerequisite for effective contract negotiation and spend management.
Committed Spend / Usage Floor
The minimum amount a buyer agrees to spend or consume within a defined period, typically annual. Committed spend establishes the baseline from which overage calculations and true-up mechanics operate. Buyers who commit above actual usage pay for capacity they do not use; buyers who commit below actual usage pay overage rates on the excess.
Consumption-Based Pricing
A pricing model in which charges are determined by the volume of units consumed, including API calls, compute hours, data records processed, and tasks completed, rather than by a fixed per-seat or per-license fee. Costs scale with usage, creating inherent budget variability that requires active monitoring to manage.
Consumption Blind Spot
The condition in which an organization has adopted consumption-based vendor pricing without building the monitoring, governance, or contract structures needed to manage variability. Costs accumulate through decentralized purchasing, audit gaps, and auto-renewal mechanics faster than finance can track, resulting in budget overruns identified after the fact.
Egress Cost
In cloud infrastructure contracts, egress refers to data transferred out of the cloud provider’s network. Egress is typically priced per gigabyte and is one of the most common sources of unexpected cloud cost overruns, particularly for organizations running data-intensive workloads or multi-cloud architectures that move data between providers.
FinOps
A financial operations discipline originally developed to manage cloud infrastructure spend, now expanding to cover the full consumption technology portfolio including SaaS and software licensing. FinOps practice centers on the intersection of technology, finance, and business operations, creating visibility, accountability, and optimization across variable-cost technology categories.
Overage Rate
The per-unit price charged for consumption above the committed spend or usage floor. Overage rates are typically set at a premium to the standard unit rate, making overages disproportionately expensive relative to contracted usage. The overage rate is one of the most consequential and least negotiated terms in a consumption contract.
Shelfware
Software licenses or contracted capacity that an organization is paying for but not actively using. In consumption-based models, shelfware manifests as committed spend that exceeds actual usage. BCG research identifies shelfware proliferation as one of the primary consequences of the shift away from predictable per-seat licensing.
True-Up
A contract mechanism that reconciles actual consumption against committed spend at the end of a defined period. In a standard true-up, if actual consumption exceeds the commit, the buyer pays the difference at the overage rate. In a “true forward” structure, an increasingly common buyer-favorable variant, excess consumption adjusts the next period’s commit rather than triggering an immediate additional charge.
Usage-Based Pricing
A pricing model closely related to consumption-based pricing, often used interchangeably, in which customer charges are determined by measured usage of a product or service. Both contrast with seat-based or subscription models in which cost is fixed regardless of utilization.
SaaS and cloud spend audit checklist
Use this checklist to conduct an initial consumption spend audit. A completed audit produces the vendor master data and consumption baseline required to stand up effective ongoing governance.
Phase 1: Inventory and contract extraction
- Collect all active SaaS, cloud, and telecom vendor agreements from legal, IT, and finance systems of record
- Identify all consumption-based contracts (distinguish from fixed-fee and perpetual license agreements)
- Extract and record for each contract: vendor name, product, committed spend or usage floor, unit rate per tier, overage rate, auto-renewal date, notice window, and named internal owner
- Flag all contracts renewing automatically within 90 days with no active renegotiation underway
- Identify all contracts lacking a named internal owner and assign one
Phase 2: Usage and utilization data
- Pull 12 months of actual consumption data from each vendor portal or API
- Calculate actual usage as a percentage of committed spend for each vendor over the audit period
- Identify vendors where actual usage is consistently below 70 percent of commit (over-provisioning signal)
- Identify vendors where actual usage exceeded commit in any billing period (overage exposure signal)
- Map usage data to a cost center or business unit to establish a departmental accountability baseline
Phase 3: Telecom-specific audit steps
- Pull the full active line inventory from the telecom provider billing system
- Cross-reference every active line against current employee and device roster
- Flag all lines not matched to an active employee or active device for termination review
- Identify lines with zero or near-zero usage in the past 90 days
- Review roaming charges for the past 12 months; identify months with material roaming spend and assess whether roaming add-on packages were in place
- Confirm that pooled data and minutes plans are sized appropriately to current usage, not historical peak or original deployment
Phase 4: Overlap and consolidation assessment
- Map the full SaaS vendor portfolio against functional categories (collaboration, analytics, marketing automation, security, etc.)
- Identify categories with two or more active vendors providing overlapping capabilities
- For each overlap, determine whether both vendors are actively utilized or whether one is effectively shelfware
- Assess consolidation opportunity: would eliminating the lower-utilized vendor create capability gaps, or is the overlap fully redundant?
- Prioritize consolidation candidates by combined annual spend and renewal proximity
Vendor segmentation framework
This framework provides the criteria and decision logic for placing each consumption vendor into one of four management tiers. Segmentation should be reviewed semi-annually or when a vendor’s spend profile changes materially.
Segmentation criteria
Consumption Volatility is assessed as the standard deviation of monthly spend over the trailing 12 months, expressed as a percentage of the monthly average. Volatility above 20 percent classifies as High; below 20 percent classifies as Low.
Spend Magnitude is assessed against a threshold appropriate to the organization’s total technology spend. A common starting point for mid-market operators: vendors above $50,000 in annual spend classify as High Magnitude; vendors below that threshold classify as Low Magnitude. Organizations with larger or smaller technology footprints should calibrate accordingly.
Management tier definitions
TRANSFORM — High Spend, High Volatility
Dedicated named owner with weekly consumption review. Real-time monitoring via API integration. Budget alert at 60% and 80% of commit. Renegotiation initiated no later than 90 days before auto-renewal. Escalation to the CFO if the forecasted run rate exceeds the budget by more than 10%.
MANAGE — High Spend, Low Volatility
Named owner with monthly consumption review. Monitoring via vendor portal or scheduled reporting. Renegotiation initiated 90 days before auto-renewal. Annual utilization audit to identify over-provisioning.
PRIORITIZE — Low Spend, High Volatility
Named owner with a monthly review. Assess whether vendor should be consolidated into a higher-spend relationship or replaced. Monitor for spend trajectory that would elevate to TRANSFORM tier.
MONITOR — Low Spend, Low Volatility
Quarterly review. Standard alert thresholds. Renewal on standard cycle with light-touch renegotiation. Flag if spend trajectory begins to rise consistently and reassess the tier at the next semi-annual review.
Related Resources


Selected sources: McKinsey & Company, AI Adjusts the Software Bill (2024); McKinsey & Company, Upgrading Software Business Models to Thrive in the AI Era (2025); McKinsey & Company, A New Era for Procurement Value Creation Across the Supply Chain (2023); BCG, Software Procurement Has Become Exceedingly Complex (2025), as reported in CIO Dive; FinOps Foundation, State of FinOps 2025; Gartner, SaaS application visibility data, as reported by nOps FinOps Statistics Report (2025); CIO.com, Cloud Costs Now No. 2 Expense at Midsize IT Companies (January 2026); Harvard Business Review Analytic Services, Balancing Cloud Costs and Business Goals with FinOps (2022); Inside Consulting client engagement data.